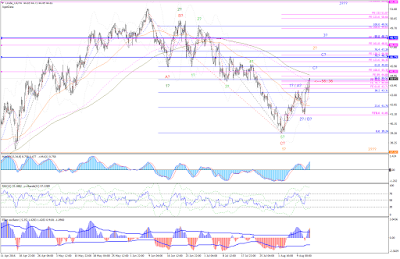
05-Aug-2016
05-Aug-2016
CMP 41.81
Sup: 39.24/35.23/26.04
Res: 51.64
Crude move is getting more complex.
At present, there are 3 possiblities I could see with Crude.
1. Bottom is in place, and started Long Term Bullish move
2. We are in complex (triangle)/Zigzag Correction
3. Correction hit it's top and we have started the final down move.
As per my analysis, I go with Option 2 (correction).
TRIANGLE
As long as crude resisted by 51.64 and supported by 26.04, we will see multi year correction is in place, and it can take 1-3 years before the final down move.
ZIGZAG
Crude completed wave B and we have started the final up move, which can target 51.64 first and further 52.28/55/62.66.
Will be updating more charts with different scenarios in separate charts soon.
SOME CHARTS ON DIFFERENT SCENARIOS:
Updates
6:24 PM IST
Check below for primary Analysis
Primary Analysis
03-AUG-2016 8:34 AM IST
CMP 39.74
RES: 40.89/41.87(89)
SUP: 39.24(21)
As long as crude resisted by 40.89$, I expect to see 39.24 again and further 38.87(89), 38.53(55), 38.06(08), 37.66, 36.68.
For any sell SL strict to 40.95/41.95 max.
As per my analysis we are extending in wave 5 of 3(C) Becouse, wave 3 of 3(C) is small.
As per my technicals and seasonality analysis, I expect to see bounce back after this down move as a corrective rally till October.
As usual, I expect to see big drop from October to Feb 2017 for lower targets.
Let us wait n watch how this progresses.
01-AUG-2016
CMP 40.98
SUP:35.26(.21)/26.07(.08)
RES: 51.67(.55)
PRIMARY ANALYSIS:
Targets:
40.1, 37.74, [37.08, 36.28], 35.75, 35.33, [33.55], 31.54,
26.04, 22, 18.34$Based on monthly chart,
Crude was not able to break thru' the multi year trendline this time. Made high 51.67 and closed below the trend line.
As per this chart, still I like to see lower low around 21, 16.89$ long term.
Based daily chart,
We could see 3 possible scenarios:
1. This correction could be a flat, which will have 3-3-5 wave structure. If this is the case, Crude can make reverse after this down move and make a new high.
2. This correction could be a triangle, which can take a long time to complete and then it will resume its last down move towards min 26.07$.
3. Thi correction has already ended up at 51.67$. If this is the case, direct fall towards 26/21/16.89$.
Have given below the charts of the possible scenarios.
As per my view, we are already in down move and can see lower lows. Will update more updates later.
OTHER CHARTS:
Are we heading to 16.89$ direct?
OR
Multi year correction is in place?
OR
Going to make a new high of 60$.
Last two years worked perfectly.
http://rajmarketresearchanalysis.blogspot.in/2015/08/wti-crude-positional-analysis-01-aug.html
http://rajmarketresearchanalysis.blogspot.in/2014/08/nymex-crude-positional-down-move-view.html
BTW, there was only single view for past two years.
This year we are having 1 primary and 2 alternative views.
Let us wait n watch, which is going to work.


