Showing posts with label S&P. Show all posts
Sunday, February 2, 2020
Wednesday, January 29, 2020
Tuesday, January 28, 2020
Monday, January 27, 2020
Wednesday, January 22, 2020
Saturday, January 18, 2020
S&P Long Term Analysis 3800, 4300? 18-Jan-2020
CMP: 3328; Sup: 3275/3261/3181
As long as the above levels support, we will see 3373-3427 first, and further 3525-3579.
Long Term Targets: 3825-3883, 4229-4415...
What happened?
14-Jan-2020
18-Jan-2020
Weekly Chart
As long as S&P trades with this trend line, it is up trend. Strategy: buy on dips as long as trend line support holds.
As long as the above levels support, we will see 3373-3427 first, and further 3525-3579.
Long Term Targets: 3825-3883, 4229-4415...
What happened?
14-Jan-2020
18-Jan-2020
Weekly Chart
As long as S&P trades with this trend line, it is up trend. Strategy: buy on dips as long as trend line support holds.
Tuesday, January 14, 2020
S&P Analaysis: More upside left as last leg. 14-Jan-2020
CMP: 3289; Res: 3300; Sup: 3268/3261
Upside targets: 3302, [3308-3310 ultimate target], 3313, [3325-3331 extension].
In both scenario, I expect to see 3295 again and more up.
Primary Scenario:
Can come down to 3286-3280 n reverse back to 3300.Upside targets: 3302, [3308-3310 ultimate target], 3313, [3325-3331 extension].
Alternative Scenario:
If 3300 resists and we are in wave 4, can see 3271-3265-3260 n reverse back to 3300 first.In both scenario, I expect to see 3295 again and more up.
Monday, January 13, 2020
Friday, January 4, 2019
Friday, November 3, 2017
Friday, October 13, 2017
Friday, April 14, 2017
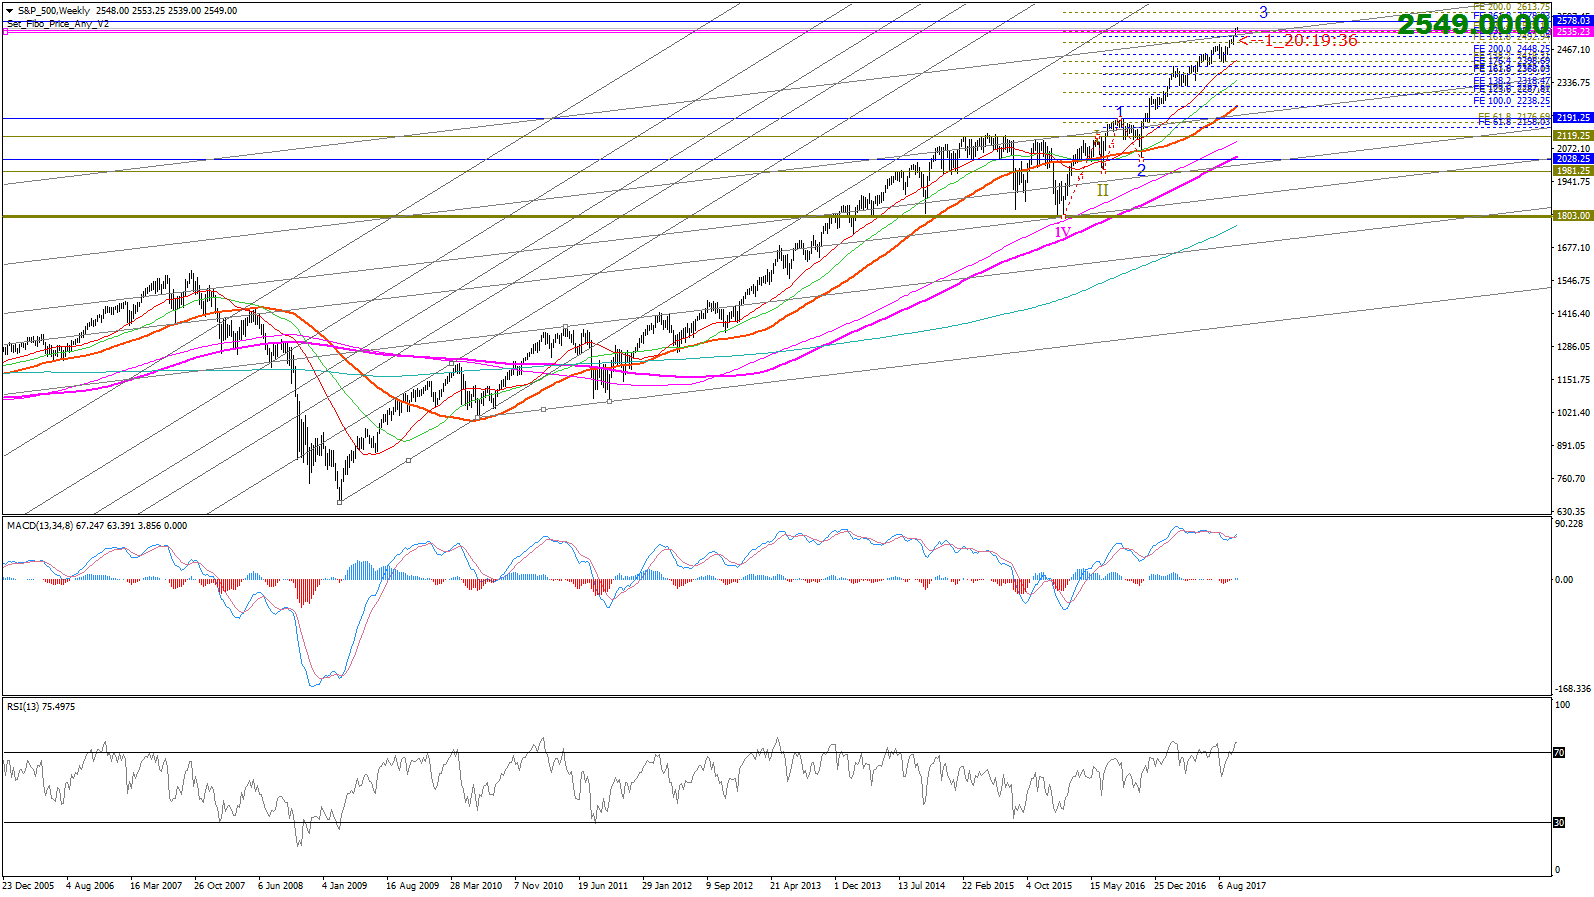
S&P Long Term Analysis 14-Apr-2017
CMP 2327.5
Are we going to see bigger correction in S&P after completing this up trend?
If you see the monthly chart, S&P resisted n supported by the following fib numbers 55, 233, 610, 987, 1597, next in the series 2584. So, will S&P going to be resisted by 2584? And we could see negative divergences in the weekly chart, which supports that, we will start bigger correction in coming months.
Are we going to see bigger correction in S&P after completing this up trend?
If you see the monthly chart, S&P resisted n supported by the following fib numbers 55, 233, 610, 987, 1597, next in the series 2584. So, will S&P going to be resisted by 2584? And we could see negative divergences in the weekly chart, which supports that, we will start bigger correction in coming months.
Subscribe to:
Posts (Atom)
-
ANALYSIS 27-FEB-2021 - BULL or BEAR? Is the correction completed? Min target done at 1732-1720. Extensions can be 1680, 1632, 1592, 1575. As...
-
An uneducated farmer My father Mr. CHINNAPPAN. KULANDAI SAMY (Sr. Lourdu Mary. FMA., Arockia Chinnappa Raj's father / Fr. A. C. Savarimu...
-
ANALYSIS 27-FEB-2021 PRIMARY SCENARIO: As long as 89.66/89.15 holds support, we can see more upside targeting 91.16, 91.38, 91.81, 92.09, 92...
GOLD/XAUUSD ANALYSIS JULY 2021
PREVIOUS ANALYSIS https://rajtechanalysis.blogspot.com/2021/06/goldxauusd-analysis-june-2021.html Long term analysis included in the above p...