Saturday, July 30, 2016
Friday, July 29, 2016
Thursday, July 28, 2016
Sunday, July 24, 2016
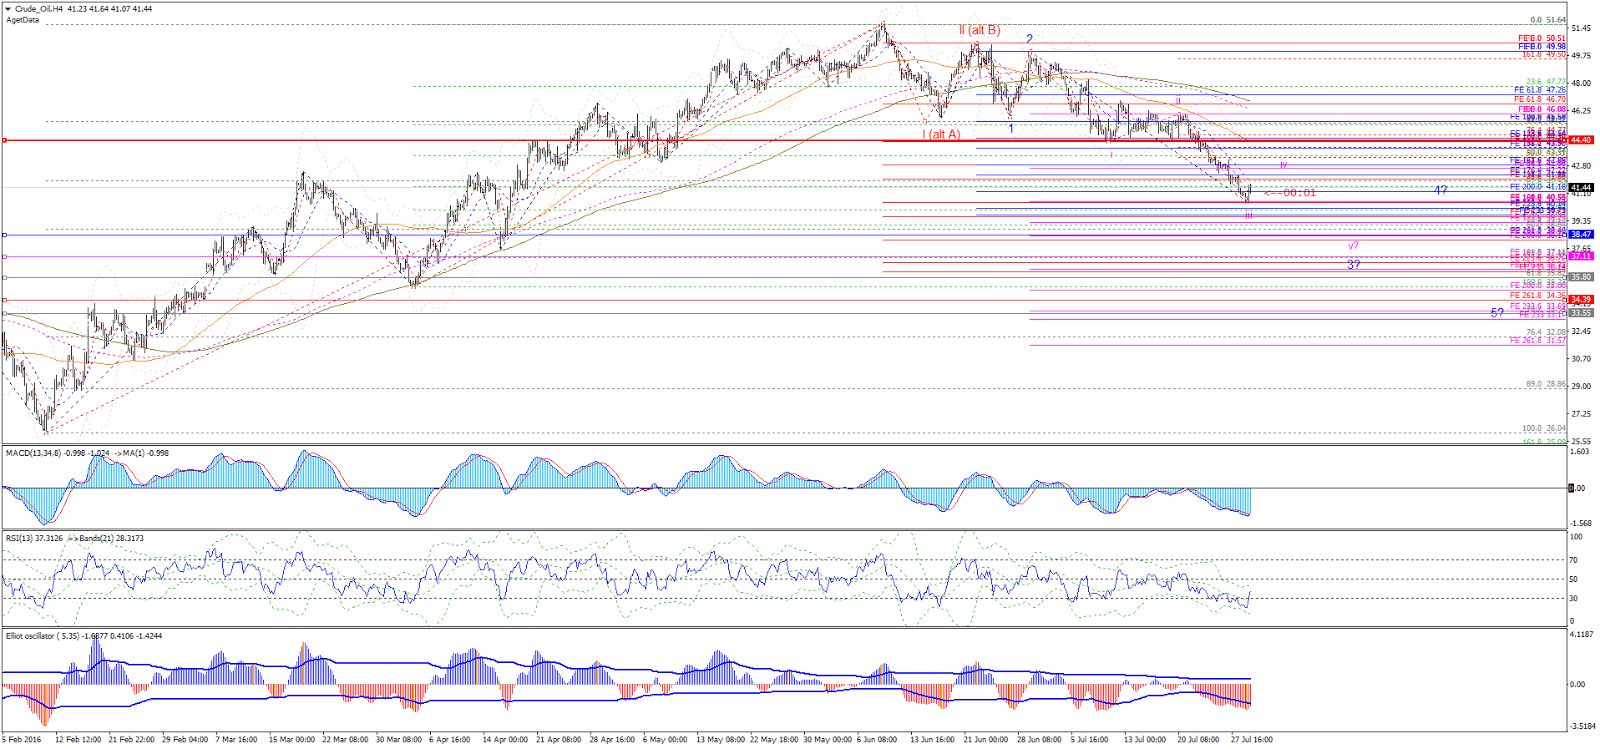
Crude Analysis 24-Jul-2016
27-Jul-2016
CMP 42.08$
Further targets: 41.4/41.14/40.29/39.96/38.50/37.73
CMP: 44.23/2964
Support: 43.73/2956
Res: 46.08/3113
As long as crude supported by 43.73/2956, I expect to see 44.90, 45.17, 45.4, 45.53, 45.82 (2992, 3013, 3033, 3051, 3065-75, 3096).
If crude resisted by 46.08/3113, I expect to see 43.73 again and further, I expect 43.2, 42.78, 41.93, 41.41 (2956 again and further 2932, [2906], 2889, 2852, [2820], 2750).
IMPORTANT LEVELS TO BE WATCHED:44.91, 45.17-45.40 / 3035, 3053-3067.
CMP 42.08$
Further targets: 41.4/41.14/40.29/39.96/38.50/37.73
CMP: 44.23/2964
Support: 43.73/2956
Res: 46.08/3113
As long as crude supported by 43.73/2956, I expect to see 44.90, 45.17, 45.4, 45.53, 45.82 (2992, 3013, 3033, 3051, 3065-75, 3096).
If crude resisted by 46.08/3113, I expect to see 43.73 again and further, I expect 43.2, 42.78, 41.93, 41.41 (2956 again and further 2932, [2906], 2889, 2852, [2820], 2750).
IMPORTANT LEVELS TO BE WATCHED:44.91, 45.17-45.40 / 3035, 3053-3067.
Tuesday, July 19, 2016
LONG TERM POSITIONAL VIEW OF CRUDE 19-Jul-2016
CMP 45.26
RES: 51.64
SUP: 26.04
I expect current move of crude to last for more time and I expect it to travel thru' triangle. Below chart shows the ideal path for crude as long as resisted by 51.64 and supported by 26.04.
MORE COMPLEX CHART with Gann Grid n Fan:
AS PER TIME CYCLE:
NOTE: I AM NOT MUCH LEARNED ABOUT TIME CYCLES. THE BELOW IS JUST A VIEW, as I CONSIDER THIS AS A BIGGER CORRECTION.
LET US SEE HOW FAR THIS WORKS OUT.
Wave B
July - Aug -> Down move
Aug - Oct -> Up move
Oct -> Feb 2017 -> Down move
Wave C
Feb - Aug -> Up Move
Wave D
Aug/Oct - Feb 2018 -> Down Move
Wave E
Feb -> May -> Up Move
May/Aug - Feb 2019 -> DOWN MOVE
Thanks.
RES: 51.64
SUP: 26.04
I expect current move of crude to last for more time and I expect it to travel thru' triangle. Below chart shows the ideal path for crude as long as resisted by 51.64 and supported by 26.04.
MORE COMPLEX CHART with Gann Grid n Fan:
AS PER TIME CYCLE:
NOTE: I AM NOT MUCH LEARNED ABOUT TIME CYCLES. THE BELOW IS JUST A VIEW, as I CONSIDER THIS AS A BIGGER CORRECTION.
LET US SEE HOW FAR THIS WORKS OUT.
Wave B
July - Aug -> Down move
Aug - Oct -> Up move
Oct -> Feb 2017 -> Down move
Wave C
Feb - Aug -> Up Move
Wave D
Aug/Oct - Feb 2018 -> Down Move
Wave E
Feb -> May -> Up Move
May/Aug - Feb 2019 -> DOWN MOVE
Thanks.
Subscribe to:
Posts (Atom)
-
ANALYSIS 27-FEB-2021 - BULL or BEAR? Is the correction completed? Min target done at 1732-1720. Extensions can be 1680, 1632, 1592, 1575. As...
-
An uneducated farmer My father Mr. CHINNAPPAN. KULANDAI SAMY (Sr. Lourdu Mary. FMA., Arockia Chinnappa Raj's father / Fr. A. C. Savarimu...
-
ANALYSIS 27-FEB-2021 PRIMARY SCENARIO: As long as 89.66/89.15 holds support, we can see more upside targeting 91.16, 91.38, 91.81, 92.09, 92...
GOLD/XAUUSD ANALYSIS JULY 2021
PREVIOUS ANALYSIS https://rajtechanalysis.blogspot.com/2021/06/goldxauusd-analysis-june-2021.html Long term analysis included in the above p...